Second day of hackathon brought us an opportunity to test data exchange between tools used by two projects. Observations and measurements produced by air quality sensors in the CITI-SENSE project were mapped on VGI Observations produced by sensors in the SDI4Apps project.
The CITI-SENSE project uses Snowflake SEDS tool for storing and publishing data with own data model. The SDI4Apps uses SensLog tool for these purposes with own data model too. Corresponding objects form CITI-SENSE were mapped on SensLog VGI extension tables. Mapping of objects from data models was not so complicated thanks the fact that both data models are derived from Observations&Measurements standard data model. The VGI extension of SensLog provides publication service in GEoJSON format, therefore is possible direct visualization of points.
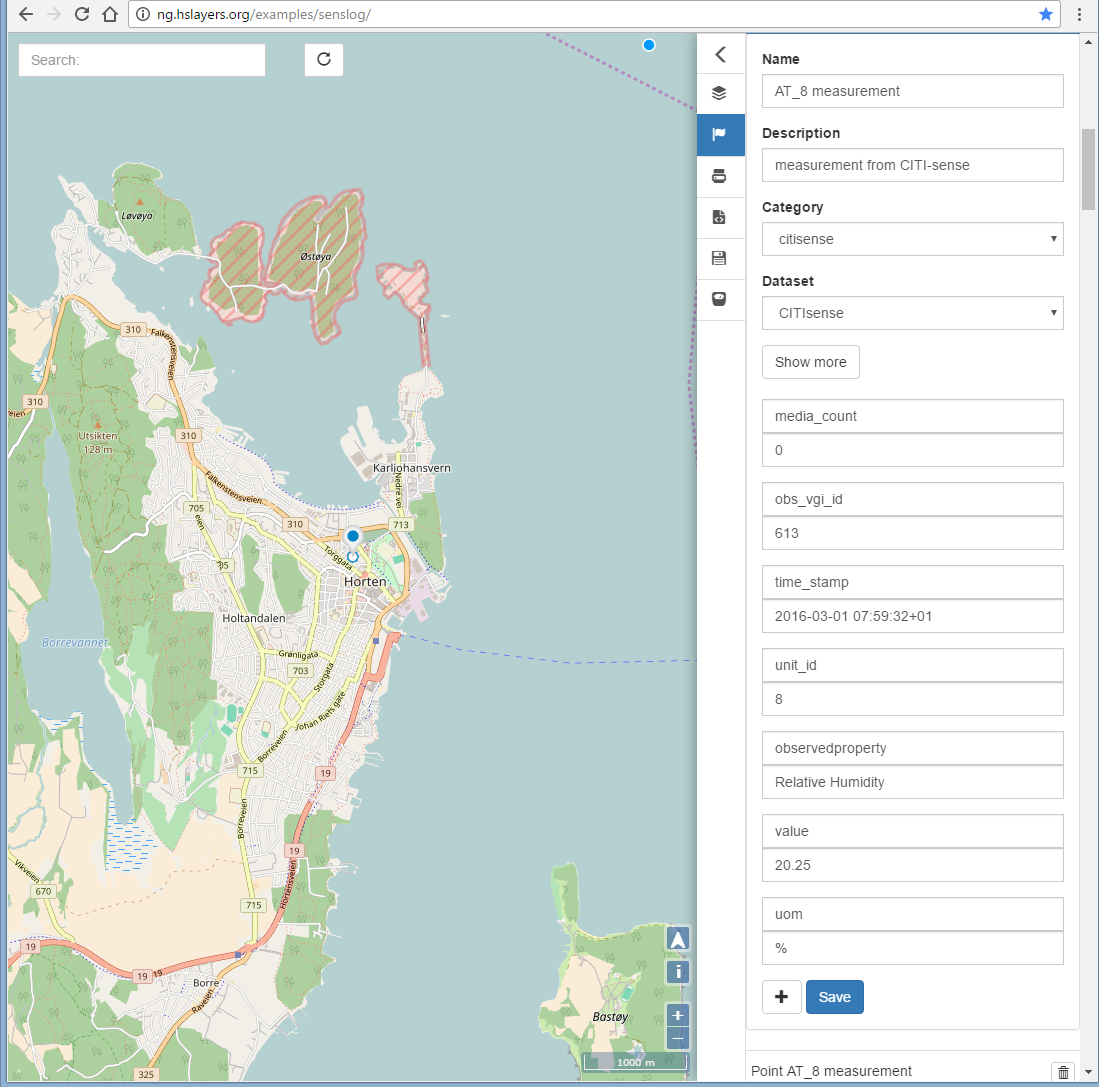
Example of measurements from the CITI-SENSE project can be found HSLayersNG visualization example. Just find “Draw new features” in the left Menu and click on some “Point AT_8 measurement” to zoom on selected point. Or look at following picture with screenshot of the visualization.